DWP statistics user engagement strategy
This strategy sets out how DWP intends to increase the quantity and quality of user engagement with the National and Official Statistics it produces.
Introduction
This document sets out the user engagement strategy for DWP statistics, with the intent of increasing both the quantity and quality of user engagement on the National and Official Statistics produced by the department.
This document is underpinned by the . This strategy outlines a clear vision and deliverables for producers of statistics within government. The 3 main goals are named as:
- Collaborate across boundaries to offer a more coherent user experience.
- Build capability and equip producers of statistics with the practical skills and tools to deliver effective user engagement activities.
- Strengthen our culture and ensure user engagement is always an ongoing and essential part of a statistics producers role.
This 鈥�DWP statistics user engagement strategy鈥� outlines how producers of statistics within DWP will seek to adhere to these goals and has been formulated in line with the GSS鈥檚 strategy recommendations for effective user engagement.
Strand 1: Understanding our users
This strand involves 3 key elements.
Strand 1A: DWP user engagement champions and statistical publication representatives
The user engagement representatives (reps) are a single point of contact for each statistical publication. This role is a continuation of the proposition in the GSS user engagement strategy, which assigned a user engagement champion to each department. The reps are integral to the delivery of this user engagement strategy, ultimately being responsible for shaping and delivering user engagement for their statistical publication(s).
The reps鈥� responsibilities include but are not limited to:
- lead and deliver user engagement or research for the statistical publication they are assigned to with support from the user engagement champions and social or user researchers if they require
- ensure that any user engagement is delivered in line with legal and ethical guidelines
- work with the DWP user engagement champion to support the delivery of the centralised survey, quantitative analysis and any other relevant user engagement projects
Strand 1B: A DWP statistics user engagement survey
This centralised survey will focus on cross-cutting strategic issues, such as , HTML templates and the coverage of the suite of DWP statistical publications. It will probe into 3 key topics, guided by the :
- trustworthiness
- quality
- value
Essentially, this survey aims to research potential and existing users鈥� attitudes towards our statistics, with the aspiration to improve our statistics 鈥� using this research as a key factor in decision making.
Strand 1C: Quantitative user research
This component outlines a supplementary strand using quantitative metrics via Google Analytics and user logs.
To take one example, Google Analytics can build sophisticated, flexible dashboards that plot the dynamics of web page hit numbers, so as to trace spikes and troughs in user interest.
Secondly, complex web applications, such as Stat-Xplore and our interactive dashboards commonly maintain extensive user logs (for example, selecting or removing geographies). This can help us to infer user behaviour patterns.
Strand 2: Developing our statistics
This strand illustrates how the insights gained from research will be used to better our statistics. Developments will be undertaken whilst seeking to balance conflicting user interests 鈥� importantly they will be led by user research.
Opportunities for development may be more overarching and strategic 鈥� for example, remedying a data presentational element on Stat-Xplore. Alternatively, they may be more targeted and specific, such as improving user guidance for submitting data requests on a specific statistical publication.
The 鈥楧eveloping our statistics鈥� strand is also responsible for ensuring that user engagement progresses. This may be done by driving forward developments such as embedding regular communications (such as mailing lists or page alerts) to keep users updated of planned developments and to promote statistics more widely.
Strand 3: Monitoring our progress
This strand involves considering the performance of our statistics, using both quantitative and qualitative metrics. An example of a quantitative performance indicator is how many web page visits our statistical publications acquire.
However, quantitative metrics are limited in their detail as well as 鈥榯elling the whole story鈥�. For example, having a large number of hits is not a measure of quality or success 鈥� while it tells us reach, it doesn鈥檛 tell us how well a publication meets needs.
Therefore, a multi-disciplinary approach is needed, using qualitative metrics in tandem with quantitative. An example qualitative performance indicator is improved user feedback via email.
Conclusion
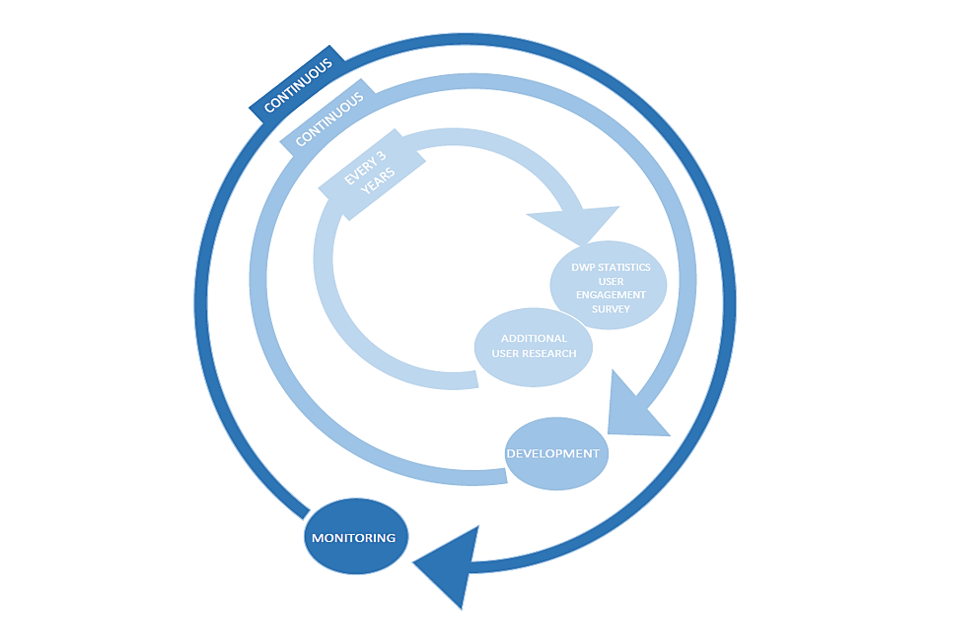
The plan is cyclical in nature, with research to be repeated every 3 years. The 鈥楧eveloping our statistics鈥� and 鈥楳onitoring our progress鈥� strands are ongoing, but will likely see their most active periods cyclically following completion of user research. See the diagram below for an illustration of this cyclical process.

Key actors will be user engagement champions, leading on the DWP statistics survey, 鈥楺uantitative user research鈥� and 鈥楳onitoring our progress鈥� strands. Also, the user engagement reps, responsible for delivering user research for their statistical publication(s).
Please contact statistics.userengagement@dwp.gov.uk with any queries.