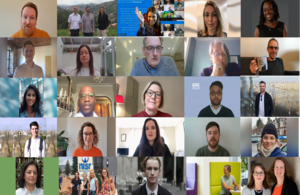
Connecting analysts together
Reflections on the first Analysis in Government Month.

Whatever makes you proud to be a government analyst, whether it鈥檚 telling stories through your data analysis to help serve citizens better, helping to answer big questions at the highest level or connecting with your colleagues and learning something new, the inaugural Analysis in Government Month had it all!
In brief:
- We sold 7,500 tickets for events,
- Provided 30 hours of event content,
- Through 22 events,
- Published 29 blogs from departments and professions across the Analysis Function,
- Premiered 6 Head of Profession videos on our YouTube 鈥淎nalysis in Government Month鈥� playlist:
,
- The achieved 167.5K impressions (a whopping 114.5K more than the previous month),
- We鈥檝e welcomed 116 new Twitter followers and
- 2,700 of you visited our Analysis in Government hub page.
Our very first day set the scene, kicking off with an opening address from Professor Sir Ian Diamond, Head of the Analysis Function and National Statistician who introduced the theme of event; 鈥楢nalysis Connect鈥� and the importance of encouraging collaborative working by bringing the analytical community together. He then led straight into a panel discussion with Professor Alison Park (Interim chair of the Economic and Social Research Council), Osama Rahman (Chief Analyst and Chief Scientific Advisor, Department for Education) and Jonathan Mills (Director General for Policy, Department for Work and Pensions), who discussed the future of analysis in government.

Clockwise from top, Professor Sir Ian Diamond, Professor Alison Park, Jonathan Mills and Osama Rahman
Focusing the discussion on high-quality analysis of data, Osama commented that 鈥淲hilst we say, 鈥榃ow, look at all this data!鈥� let鈥檚 not forget we need the full range of analytical skills that cover both breadth and depth鈥�.
We sold a phenomenal 7,500 tickets for seminars throughout the month, with delegates choosing from panel sessions, tackling big issues such as climate change and how data can make children鈥檚 lives better, learning seminars and connection opportunities, as well as daily blog posts from colleagues across the Analysis Function, giving us an insight into their work.

We enjoyed exploring topics such as data visualisation, Reproducible Analytical Pipelines (RAP) and how to make spreadsheets accessible, rounding the month off with a fantastic Hackathon event, really capturing the month鈥檚 theme of connectivity. During the Hackathon, groups of 45 delegates from 17 different departments and various professions, worked together to answer six research questions posed by the Joint Biosecurity Centre (JBC), The Office for the Children鈥檚 Commissioner and the Office for National Statistics (ONS).
The best thing is that it鈥檚 not too late to catch up on the terrific stories told by your government analyst colleagues through blogs and videos, all of which are available on our Analysis in Government Month hub page. Make sure to for more on highlights from the month.
We鈥檇 love to hear from you, what were your highlights and what would you like to see more of at future events? Email [email protected] to let us know.
Make sure you don鈥檛 miss out on any of our exciting events in the future, subscribe to the Analysis Function Newsletter and .